
株トレ-株式投資トレーニング&シミュレーション
by TSMスマートアプリ
🗂️ Finance
Features 株トレ-株式投資トレーニング&シミュレーション
Stock investment training and simulation can be performed using stock price data of Nikkei 225 and JPX400 stocks for about one year (* 1).*1)Once downloaded stock data is downloaded again within one year, the past data will be accumulated.
For example, if you download again after 1 year, you can use the first downloaded data + 1 years worth of data (Past data will be deleted after 1 year).If you set the stock and start date (past date), past candlesticks and moving averages will be displayed.
If you advance the date, the stock price of the next day will be displayed, and profit and loss will be calculated based on it.Make full use of this app, learn your own investment techniques, and use them for actual stock investment.
Practice never betrays!◆ Features・Simple operation・Training using Nikkei 225 and JPX400 stock data for the past 1 year・Base color can be selected from white and black・ Candlestick color can be selected from 6 types・You can select from 12 types of moving average lines (up to 5 moving average lines can be displayed at once)・Selectable from SMA (simple moving average) and EMA (exponential moving average)・Buying/Selling can be selected from donation (opening price on the next day), close (closing price on the day), limit price (next day), stop loss (next day)・You can choose from donation, fixed closing, and selection at the time of ordering.・ Display win and RR ratio at the end of trading (Ver6.00 or later)・Number of shares to be traded: 1 to 99,999 shares・Buying and selling transactions can be done in parallel (image of buying and selling margin trading)・Vertical and horizontal display possible・ Output display (from Ver7.00)◆ Stock price data・For stock price data, we use the stock price data downloaded from the sites of "Nihon Keizai Shimbun" and "Kabutan".・Stock price data is downloaded when stocks are selected.・Use stock price data from January 2011 to the present・From Ver6.50, JPX400 stocks are also included.◆Notes・Connection to the Internet environment is required only when downloading stock price data.・Actual stock trading is not possible.
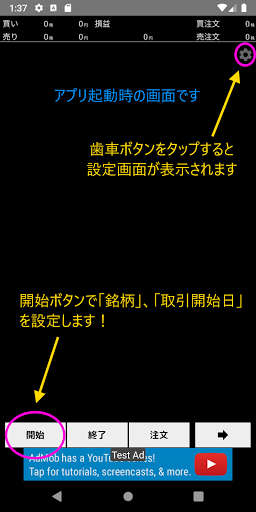
It is only training and simulation using past data.・ Stock price data downloaded with this app is only used within the app and is not redistributed.◆How to use[How to start training]1.
After launching this application, tap the "Start" button2.
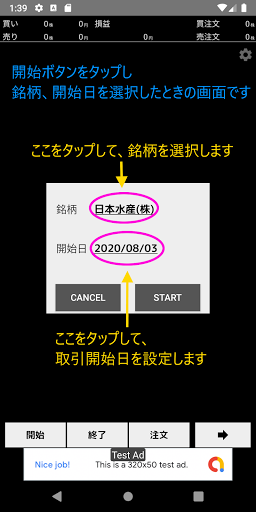
Tap the underlined part to the right of the "stock" display3.
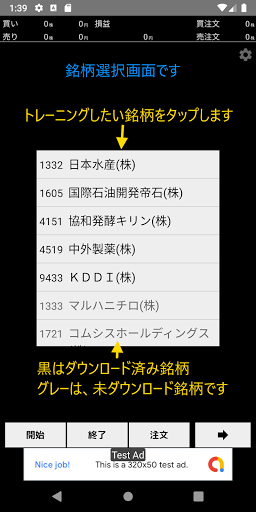
The Nikkei 225 stock list will be displayed, so tap the stock you want to train.4.
A download dialog will appear and the stock data will be downloaded5.
When the download dialog closes, the stock data download is complete.* Black stocks are stocks that have already been downloaded once, so only the updated ones will be downloaded.* Gray symbols download all data6.
Tap the underlined part to the right of the "start date" display7.
A calendar will be displayed, so tap the start date*If the selected start date is not a business day, it will be the nearest business day in the past8.
This completes the settings for starting training.
Tap the "START" button to display candlesticksThe data displayed on the far right is the data for the start date (only the left half of the candlestick is displayed)[Training (trading) method]・When you tap the arrow button, the "start date" set above advances by one day and the graph is updated.- Buy and sell orders can be made by tapping the "order" button・Set the number of shares to "buy" or "sell", whether to add or sell (repurchase), set the order settings (donation, etc.), and tap the OK button to confirm the order.・If the order setting is "close", the order will be confirmed on the spot.・If the order setting is "Donate", "Limit" or "Stop", tap the arrow button to advance the date by one day and the order will be confirmed.・In cases other than "Close", the number of shares for "Buy Order" and "Sell Order" will be displayed until you tap the arrow button.・ You can check the number of shares bought and sold, the average unit price, and the current profit and loss on the display.・Past stock prices can be displayed by swiping right on the chart screen.・You can zoom in and out on the vertical axis by pinch zooming vertically.・If you pinch zoom horizontally, you can zoom in and out on the horizontal axis (there is a limit to zooming out).・If you tap the chart, the opening and closing prices of the tapped date will be displayed.・If you tap near the "Profit and Loss" display at the top of the screen (in the case of vertical display), the current profit and loss status will be displayed.[How to finish training]・When you tap the end button, a dialog will be displayed.Tap OK to end the training.・Profit and loss for each purchase and sale, and overall profit and loss are displayed.・From Ver6.00, win rate and RR ratio will be displayed.・You can turn off the display by clicking the X mark on the upper right.・If you tap the exit button while holding shares, please select whether to force it.【Setting items】Tap the gear button on the top right of the screen to enter the setting screen1.
Basic settings≪Background color setting≫You can choose from white or black<>The maximum number (number of candlesticks) that can be displayed in vertical display and horizontal display can be set below.Setting 1: (vertical screen: 30 lines, horizontal screen: 50 lines)Setting 2: (vertical screen: 40 lines, horizontal screen: 60 lines)Setting 3: (vertical screen: 60 lines, horizontal screen: 80 lines)≪Trading Settings≫You can set the trading timing settings below- next days donation- Closing date of the day- Set when ordering (Ver2.00 or later)2.
Candlestick settingsCandlestick color type can be set from the following- Positive line: Blue, Negative line: Red- Positive line: White, Negative line: Black- Positive line: Blue, Negative line: Black- Positive line: White, Negative line: Gray- Positive line: Green, Negative line: Red- positive line: LightBlue, negative line: Red3.
Setting the moving averageUp to 5 moving average lines can be displayed.Since it is not displayed at the time of initial setting, please set it as necessaryThe setting items from moving average line 1 to moving average line 5 are common and are as follows.·To enableTap to toggle between enabled/disabled・Number of days of moving average5 days, 10 days, 20 days, 25 days, 40 days, 50 days, 60 days, 75 days, 100 days, 150 days, 200 days, 300 days can be selected.・Types of moving averagesYou can select SMA (simple moving average) or EMA (exponential moving average)・Color of moving average lineRed, blue, green, light blue, purple, orange, yellow, black, white can be selected.4.
Trading history・History displayYou can refer to the order details for each past transaction (order)・Delete historyDelete all trading (order) history5.
Transaction history・History displayYou can refer to past transaction history・Delete history"Delete all transaction history6 Product data・Data deletionYou can delete the stock price data for each stock currently downloaded.
Social Features
Connect and share with friends and the community.
Gaming Features
Enjoy immersive gaming experience with various game modes.
Productivity Tools
Boost your productivity with powerful tools and features.
See the 株トレ-株式投資トレーニング&シミュレーション in Action
Get the App Today
Available for Android 8.0 and above